Understanding Limo Anywhere\’s Enhanced Reporting and Analytics
In our August 9 Release Notes we announced the updates and enhancements that we made to the Reporting & Analytics within Limo Anywhere, and in this blog we’ll take a deeper look at the new and improved dashboard.
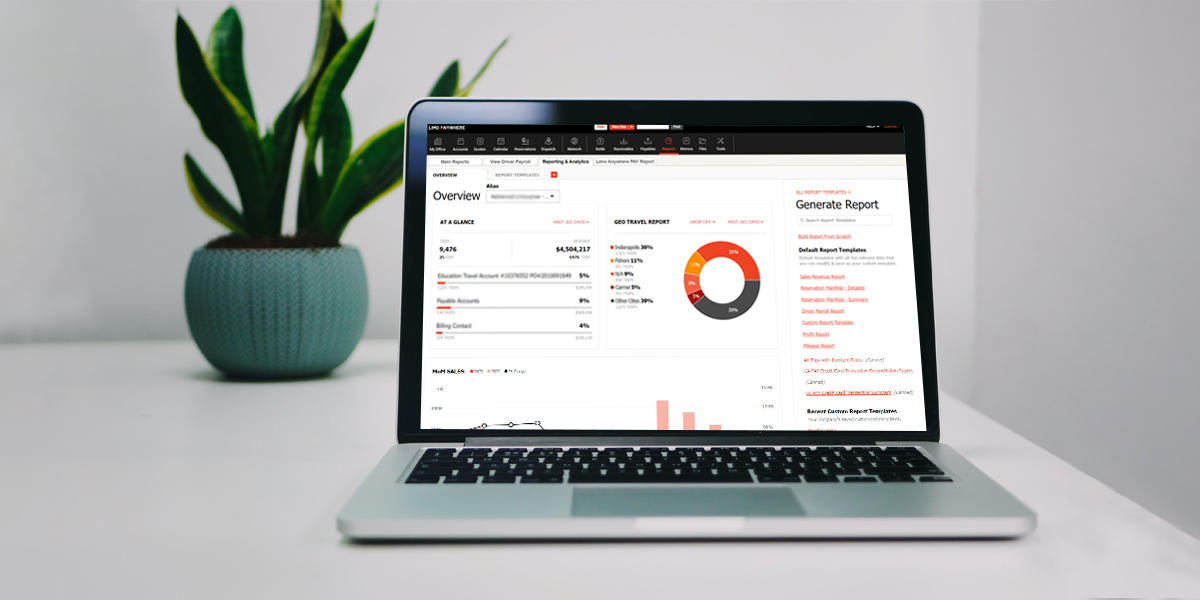
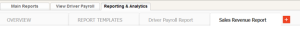
To access the Reporting & Analytics dashboard click the “Reports” icon from the Navigation bar, then select the Reporting & Analytics tab. The new dashboard is located within the “Overview” tab. Default Report Templates are now available in the “Report Templates” and you can open multiple report tabs at once by clicking the “+” icon.
Dashboard Overview
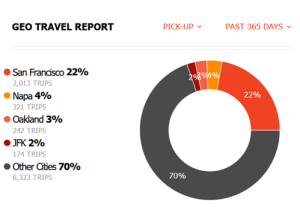
Trip Statistics
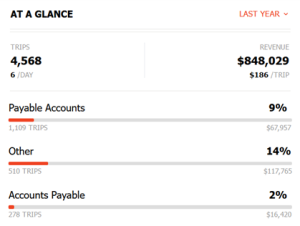
The “At a Glance” section of the can show you a snapshot of trip count, revenue, most frequent travelers, and most common pick-up and drop-off locations filtered by relevant date criteria (Past 365 Days, Last Year, YTD, MTD, This Month, and Last Month).
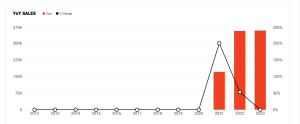
 Revenue Charts
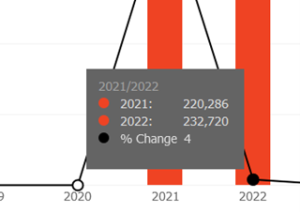
Limo Anywhere’s new revenue charts allow you to easily review both monthly and annual fluctuations in your revenue. The monthly (MoM) report allows you to easily compare the current year to the previous year while the annual report (YoY) provides data from the current and 2 previous years for comparison.
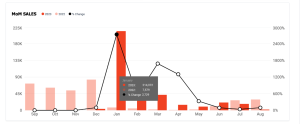
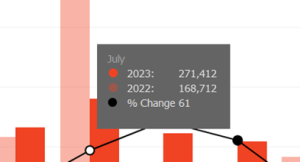
You can also view more detailed information for each respective month or year by hovering over individual data points.
As always, your feedback plays a pivotal role in our ongoing efforts to enhance and improve Limo Anywhere’s services. Please feel free to reach out with any questions.
Recent Posts

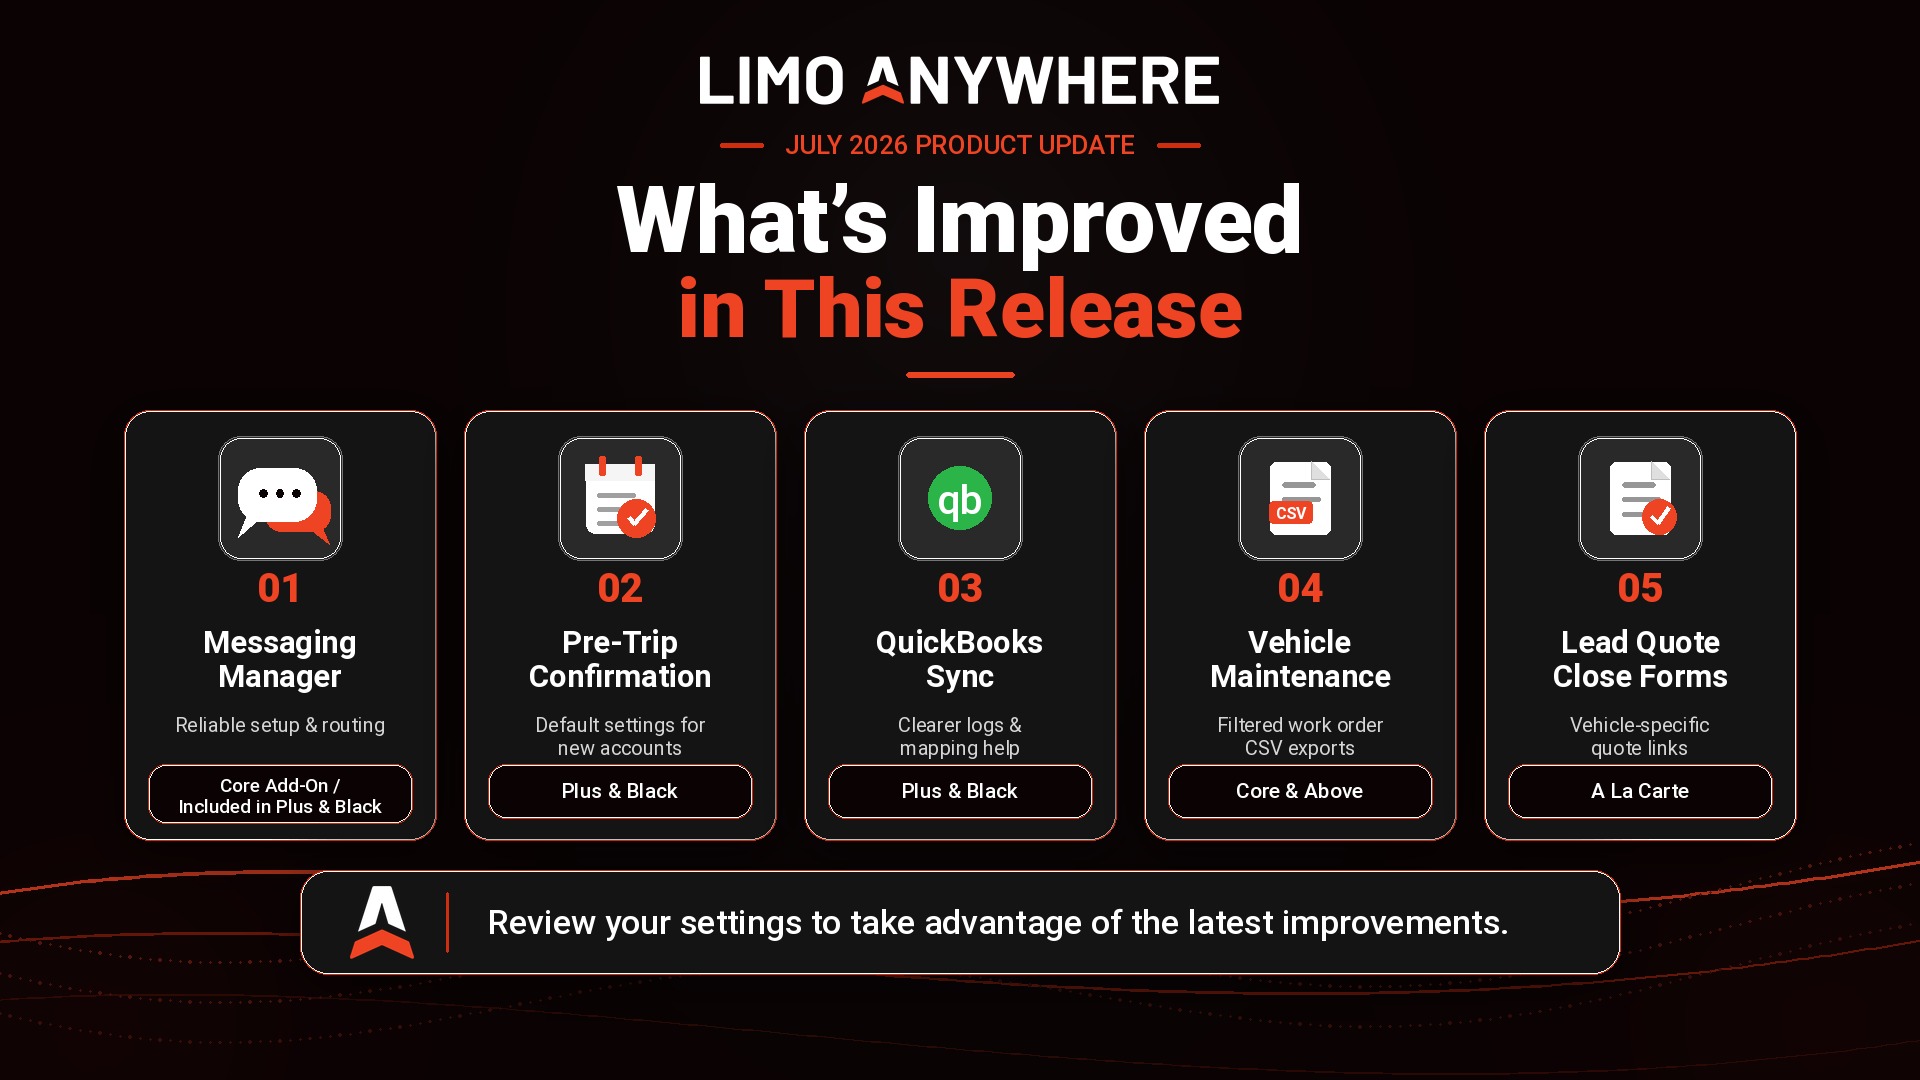
July Product Release Update
Sunday July 5, 2026